An Office of National AIDS Policy progress report obscures the state of the domestic U.S. HIV/AIDS response
By Mark Harrington
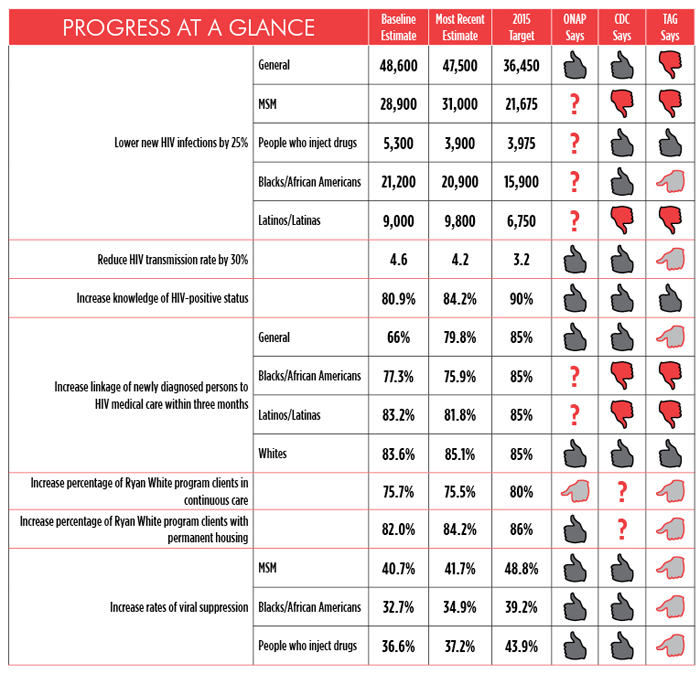
On World AIDS Day, December 1, 2013, the White House Office of National AIDS Policy (ONAP) issued a peppy and upbeat status report on the National HIV/AIDS Strategy (NHAS), claiming progress on eight of nine outcome indicators. Yet when reviewed in tandem with a companion document, HIV Prevention Progress Report, 2013, released by the U.S. Centers for Disease Control and Prevention (CDC), many of the White House claims are misleading and undermined by flawed methodology.
ONAP contends that HIV incidence in the United States is decreasing. The White House notes an estimated 47,500 new infections in 2010, versus 48,600 in 2006—a drop of approximately 1,100 new infections over four years. The CDC claims that the 2010 NHAS target (48,600) was met. The 2010 target was the same as the estimated number of new infections in 2006. Moreover, the estimated 47,500 new infections for 2010 fall well within the 95 percent confidence interval error bars—a range used to reflect uncertainty in reported measures—which neither ONAP nor the CDC mentioned in their widely disseminated reports. These error bars are shown in the surveillance data source on which both reports rely, indicating the true incidence likely falls somewhere between 42,000 and 53,000. In other words, we do not know whether HIV incidence actually decreased between 2006 and 2010.
Missing from the White House report are more nuanced incidence estimates, particularly among hard-hit groups such as men who have sex with men (MSM). The CDC report notes that new HIV infections increased 12% among MSM overall and 22% among young MSM ages 13–24 between 2008 and 2010, and that new infections among Blacks/African Americans appeared to rise from 2009 to 2010.
As for the HIV transmission rate—the likelihood that an HIV-positive person will transmit the virus to others—the White House and CDC note that this fell from 4.6 per 100 persons living with HIV in 2006 to 4.2 in 2010, a decrease of nine percent. According to the CDC report, “the 2010 target (4.6) was exceeded… As a result, the number of new HIV infections has remained stable, even though the number of people living with HIV increased 9% from 1,045,800 in 2006 to 1,144,500 in 2010.” As noted before, the surveillance data error bars for HIV incidence and prevalence estimates—both of which are used to calculate the transmission rate—are quite broad, so it’s not clear whether these data are reliable. Of note, the transmission rate in 2007 was higher than in 2006, at 4.7 per 100 cases; the 2015 target is 3.2 per 100.
An essential goal of the National HIV/AIDS Strategy is to improve the number of people living with HIV who are diagnosed, linked to care, retained in care, and maintaining an undetectable viral load.
ONAP and the CDC are in agreement that knowledge of HIV serostatus is rising. The White House contends that the proportion of U.S. residents who know their HIV status increased from 80.9% in 2006 to 84.2% in 2010, whereas the CDC states that HIV serostatus knowledge increased 9% from 1,045,800 in 2006 to 1,144,500 in 2010. Surveillance source error bars for these data, compared with 2006 estimates, allow for the conclusion that more people are learning their HIV status, which is a good thing.
Linkage-to-care progress is muddier. The White House claims that linkage to care within three months of diagnosis rose from 65% in 2006 to 79.8%—an apparently significant jump. Yet CDC reported that linkage to care actually fell from 81.7% in 2008 to 79.8% in 2010. The CDC technical notes indicate that the metrics here are spotty, as they are based on data reported from jurisdictions that reported all CD4 and viral-load results to the CDC. In 2009, these included 13 jurisdictions such as California (San Francisco only) and New York State (excluding New York City). Kentucky joined up in 2010. New York City and Los Angeles joined in 2011 along with five other states. In effect, we don’t have data on linkage to care from 31 states and from all of California except for Los Angeles and San Francisco.
As for retention rates, the White House cited Ryan White data to conclude that 75.7% of people with HIV were in continuous care in 2010, compared with 75.5% in 2011—a 0.2% drop. Nonetheless it claimed that this figure was stable. Meanwhile, the CDC progress report stated that the goal has been increased to 85% for all age groups. Either way, there is no apparent progress towards the original 80% goal or the revised 85% goal.
The White House claimed that the percentage of Ryan White program clients with permanent housing rose from 82% in 2009 to 84.2% in 2010. The White House did not give a data reference for this claim. Nor did it provide a data source for its claim that, in in 2011, transgender and injection drug–using clients were least likely to report stable housing (74.5% and 75.6%, respectively), rendering both reported outcomes inevaluable.
As for rates of viral-load suppression, the White House noted improvements among MSM (40.7% in 2009 to 41.7% in 2010—a 1% increase), Blacks/African Americans (32.7% in 2009 to 34.9% in 2010), and Latinos/Latinas (36.6% in 2009 to 37.2% in 2010).
The CDC progress report claims, “the overall percentage of HIV-diagnosed people with a suppressed viral load remained fairly stable from 2009 (37.3%) to 2010 (39%).” Meanwhile, the CDC technical notes point out that data from 2009 were used to establish the baseline. The problem here, again, is that viral-load data were available from only 13 jurisdictions in 2009.
While most of the other White House baseline data were from 2006, at least here the CDC is being relatively methodologically sound, measuring progress toward NHAS goals that were only established in 2010, from a baseline number at 2009 to 2010. In other metrics, the White House claimed progress from 2006 to 2010 toward a National Strategy that was only launched in 2010—a logical impossibility.
The target numbers for viral-load suppression underscore the breathtaking lack of ambition of the overall NHAS itself. When President Obama issued the HIV Care Continuum Executive Order on July 15, 2014, he claimed to be adopting the use of the HIV treatment cascade as a metric to monitor overall HIV program quality. Setting 2015 targets for viral-load suppression among those in care at only 48.8% for MSM, 39.2% for Blacks/African Americans, and 43.9% for Latinos/Latinas is totally inadequate if we are to achieve the promise of the HIV continuum of care, and the targets ratify the very health disparities the NHAS is supposed to address.
We must demand much more ambitious targets for the next iteration of the National HIV/AIDS Strategy. In the meantime, we have a right to expect much more honest, rigorous, and methodologically sound data from ONAP and from the CDC itself, whose Progress Report at least owns up to far more failures than the White House report does (see figure).
Simply put, the White House and CDC need to do a better job of documenting the actual epidemic situation in the 2014 report on the National HIV/AIDS Strategy.•